
Question Title
How to format axis labels?
Question Description
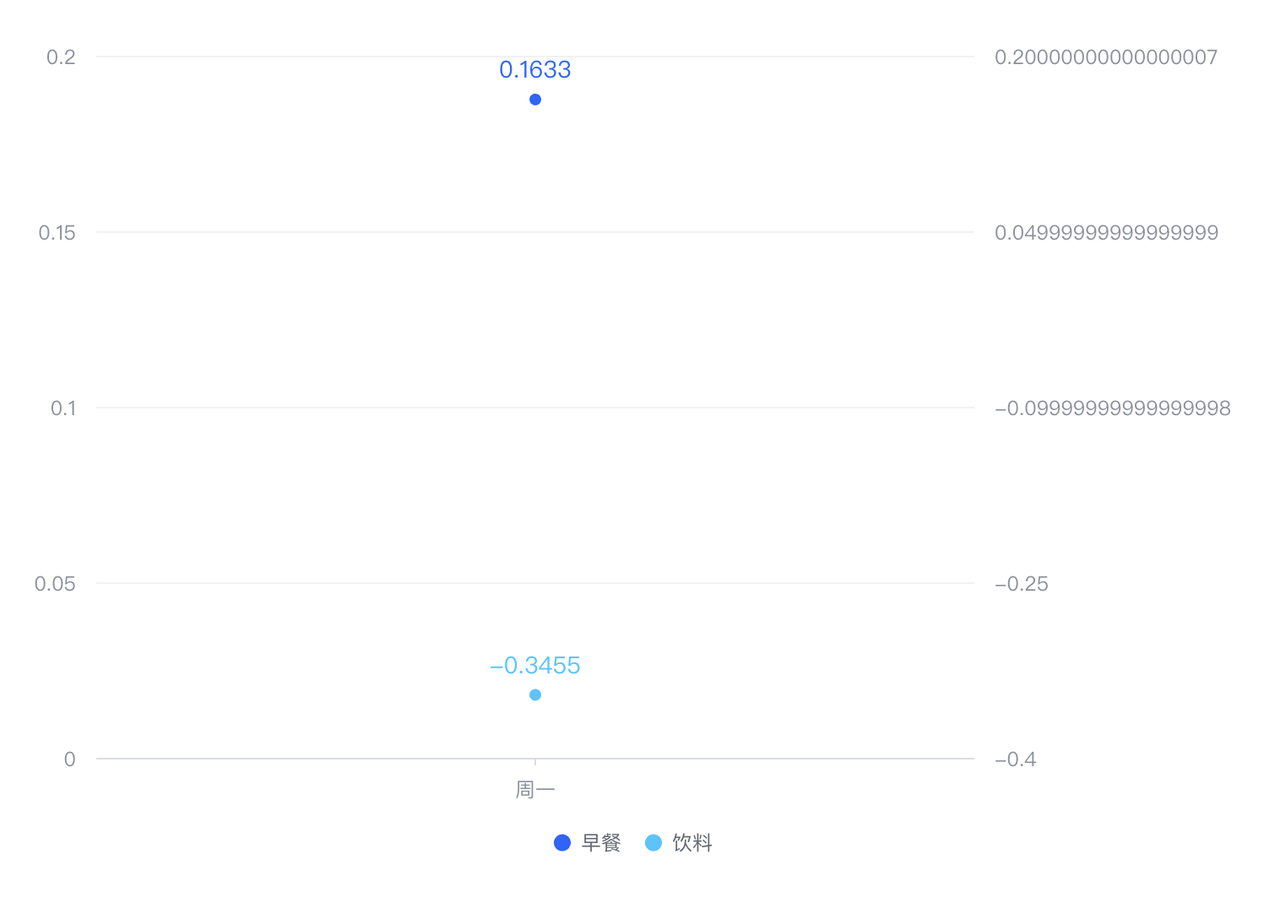
As shown in the figure, when the axis label value is inaccurate with a very long decimal point, can it be formatted?
## **Solution**
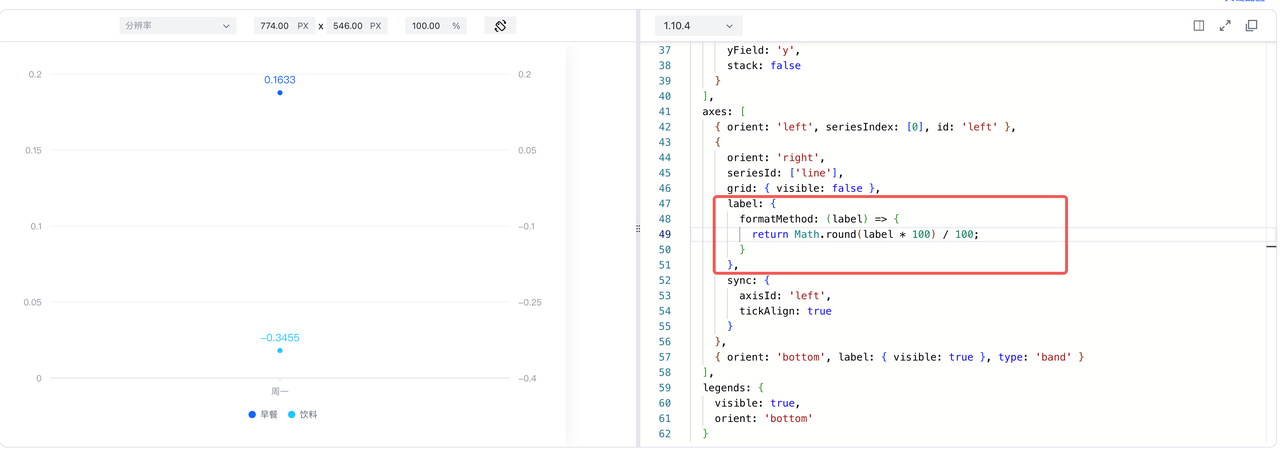
The problem of floating-point precision here is due to the addition operation of floating-point numbers when realizing the alignment of the axis scale. To improve the readability of axis labels, you can format the axis labels through label.formatMethod.
Code Example
const spec = {
  type: 'common',
  seriesField: 'color',
  data: [
    {
      id: 'id0',
      values: [
        { x: 'Monday', type: 'Breakfast', y: 0.1633 },
      ]
    },
    {
      id: 'id1',
      values: [
        { x: 'Monday', type: 'Drink', y: -0.3455 },
      ]
    }
  ],
  series: [
    {
      type: 'line',
      id: 'line',
      dataIndex: 0,
      label: { visible: true },
      seriesField: 'type',
      dataIndex: 0,
      xField: ['x', 'type'],
      yField: 'y'
    },
    {
      type: 'line',
      id: 'line',
      dataIndex: 1,
      label: { visible: true },
      seriesField: 'type',
      xField: 'x',
      yField: 'y',
      stack: false
    }
  ],
  axes: [
    { orient: 'left', seriesIndex: [0], id: 'left' },
    {
      orient: 'right',
      seriesId: ['line'],
      grid: { visible: false },
      label: {
        formatMethod: (label) => {
          return Math.round(label * 100) / 100;
        }
      },
      sync: {
        axisId: 'left',
        tickAlign: true
      }
    },
    { orient: 'bottom', label: { visible: true }, type: 'band' }
  ],
  legends: {
    visible: true,
    orient: 'bottom'
  }
};
const vchart = new VChart(spec, { dom: CONTAINER_ID });
vchart.renderSync();
// Just for the convenience of console debugging, DO NOT COPY!
window['vchart'] = vchart;</br>
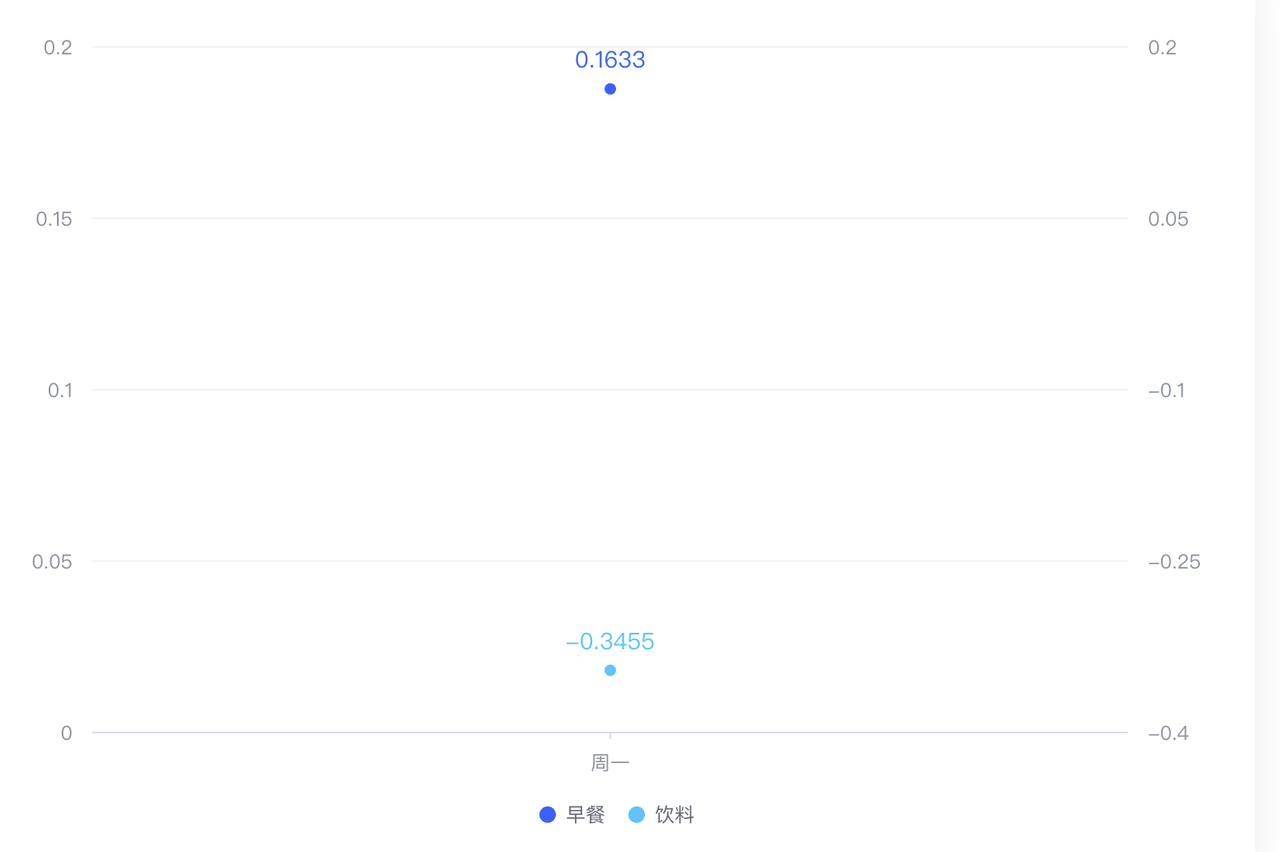
Result Display
Related Documentation
Related configuration: https://www.visactor.io/vchart/option/barChart-axes-linear#label.formatMethod
Axes axis tutorial: https://www.visactor.io/vchart/guide/tutorial_docs/Chart_Concepts/Axes
github: https://github.com/VisActor/VChart